

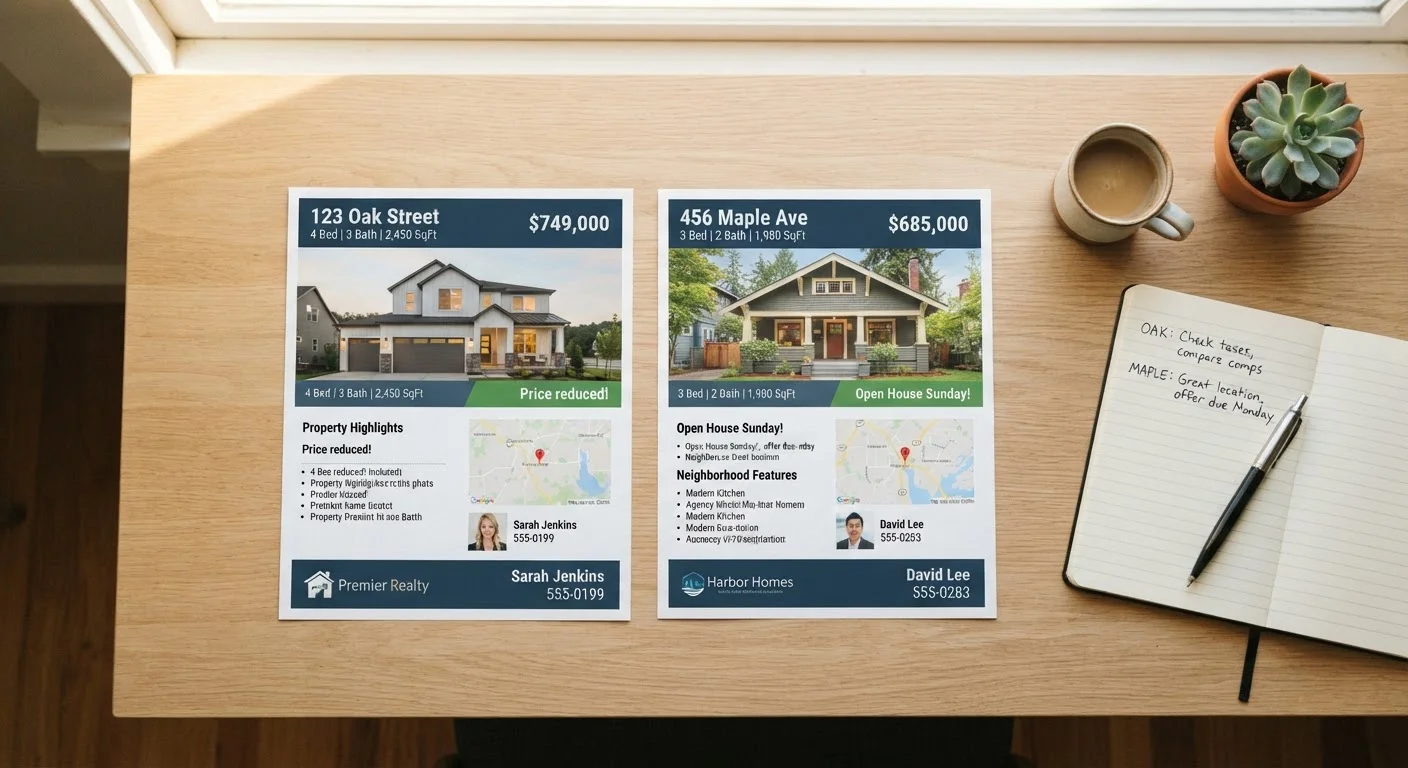
Why Two Similar Listings Rarely Are
When two properties share the same bedroom count, similar square footage, and comparable list prices in the same ZIP code, it is tempting to treat them as interchangeable. In practice, even modest differences in year built, condition, carrying costs, or location context can translate into tens of thousands of dollars over the life of ownership. The challenge is that real estate listings are marketing documents, not neutral data sheets — which means the comparison work falls to the buyer.
A disciplined, data-driven side-by-side comparison protects against two common failure modes: anchoring on the first property you view, and letting aesthetic appeal override financial reality. For a broader framework on evaluating any listing from search to offer, see the guide on interpreting a real estate listing. The steps below give you a repeatable structure to apply whenever two listings are genuinely competing for your attention.
What you will need
Spreadsheet or comparison worksheet
Records data points from both listings in a structured grid so differences are immediately visible.
County assessor or tax portal
Verifies property tax history and assessed value independent of what the listing states.
Mapping or street-view tool
Allows you to evaluate each property's immediate surroundings, street context, and proximity to amenities.
Calculator
Used to compute price per square foot, estimated monthly carrying costs, and other normalized metrics.
Property disclosure documents
Surfaces known defects, past repairs, and material facts that the listing description may not highlight.
Running the Comparison
Work through the steps below in order. The sequence moves from quantitative metrics — where objective comparison is straightforward — to qualitative judgments that require more interpretation. Having the numbers locked down first prevents subjective impressions from distorting what the data actually shows.
Pull the full listing data for both properties
Go beyond the summary card. Open each full MLS listing or listing portal page and locate every available field: list price, square footage, lot size, year built, HOA fees, days on market, number of bedrooms and bathrooms, parking, basement or garage details, and listed condition. Copy these into your comparison worksheet — one property per column.
Normalize price by square footage
List price alone is an incomplete metric. Divide each property's list price by its finished square footage to get price per square foot. This single calculation often reveals that a lower-priced property is actually more expensive on a normalized basis — or vice versa. Record both the raw price and the per-square-foot figure side by side.
Compare days on market and listing history
Check how long each property has been listed, and whether it has had prior listing periods (sometimes shown as "re-listed" or reflected in a lower original list price). A home that was listed, withdrawn, and relisted may have had a failed contract or inspection issue. Your agent or a public listing history tool can surface this information.
Verify tax history and assessed value
The tax figures shown in a listing reflect historical data and will not necessarily represent your future bill. Look up each property on the county assessor's website to confirm the current assessed value and tax levy. For more on this, see how property tax history affects what you'll actually pay. Record the annual tax figure and factor it into your monthly carrying cost estimate for each property.
Evaluate the listing descriptions critically
Read the marketing copy for each listing with attention to what is — and is not — said. Vague phrases, selective emphasis, and softened language often signal conditions worth probing. Our guide on reading between the lines in listing descriptions covers common signals to watch for. Note any language differences that suggest one property carries more uncertainty than the other.
Map each property's immediate context
Use a street-level mapping tool to examine what surrounds each address: adjacent land use, proximity to busy roads, commercial properties, power lines, and walkability to amenities. Two listings that appear equivalent on paper can differ substantially in livability based on their immediate environment. Record observations about each location in your comparison grid.
Summarize your findings and assign priority weights
With all data entered, review the grid and identify where the properties diverge most significantly. Not every difference carries equal weight — a $30 monthly HOA difference matters less than a 20-year gap in the age of the roof or HVAC system. Assign relative importance to each row based on your specific priorities, then use this weighted summary to decide which property warrants a closer look first. Before you schedule tours, run each listing through the pre-tour listing checklist to confirm you've covered every key factor.
Use a Spreadsheet to Stay Objective
A simple spreadsheet with properties in columns and data points in rows keeps your comparison anchored in facts rather than impressions. Include a weighted scoring column if certain factors — school district, commute time, lot size — matter more to your situation. Revisit the spreadsheet after each tour to update observations.
Days on Market Can Signal Hidden Problems
A listing that has sat on the market significantly longer than comparable homes in the same neighborhood may have an underlying issue — pricing, condition, title complications, or failed inspections. Treat extended market time as a flag worth investigating, not an automatic opportunity.
Don't Rely on Listing Photos Alone
Photos are curated marketing tools, not objective documentation. Wide-angle lenses and selective staging can make spaces appear larger or more finished than they are. Always cross-reference what you see in images against the stated square footage, room count, and condition disclosures. See how listing photos can mislead for a deeper look at this issue.
This article is for general informational purposes only and does not constitute financial, legal, or real estate advice. Individual circumstances vary. Consult a licensed real estate professional for guidance specific to your situation.